Fiduciary Duty of Tokyo Star Bank
“Protect & Build”
The following policies are TSB’s response to the Financial Services Agency's “Principles for Customer-Oriented Business Conduct”.
- Tokyo Star Bank’s “Fiduciary Duty Policy”
- 1Purpose of Formulating This Policy
Tokyo Star Bank has established and will comply with its “Fiduciary Duty Policy” in order to ensure the thorough implementation of customer-oriented initiatives. Under this policy, we aim to be a company that can gain our customers’ peace of mind and trust, and we will periodically disclose specific initiatives and the status of our efforts.
- 2Vision
In order to realize the pursuit of the best interests of our customers, all employees of the Bank will strive to provide high-quality financial services and solve our customers' problems with a high level of professionalism and ethics.
- 3Ensuring an Appropriate Conflict of Interest Management System
Without limiting ourselves to our own financial products and services, we will select financial products and services that truly meet the needs and interests of our customers, and always strive to propose and provide products and services that are appropriate for each customer’s and each company’s life plan from their perspective.
- 4Providing Appropriate Information to Customers
To help customers select suitable products and services, we will provide appropriate information, including regarding the fees, and the like, and strive to provide clear and detailed explanations so that all customers can fully understand the information.
- 5Practice Customer-Oriented Consulting
We will strive to propose and provide products and services suitable for the customer in light of the customer's financial knowledge, transaction experience, assets, wealth management objectives, needs, and the like, as financial professionals.
- 6Establishment of a Customer-Oriented Sales System
In order to provide the best products and services to our customers, we will work to improve the knowledge, skills, and compliance awareness of our employees. In addition, we will strive to establish a corporate culture in which all employees share an awareness of, and practice, this policy.
| Financial Services Agency, “Principles Concerning Customer-Oriented Business Conduct”. | Tokyo Star Bank Fiduciary Duty Policy |
|
|---|---|---|
| Formulation and publication of policies regarding customer-oriented business conduct, etc. | Principle 1 | 1. Purpose of Formulating This Policy |
| Pursuit of customers' best interests | Principle 2 | 2. Vision |
| Appropriate management of conflicts of interest | Principle 3 | 3. Ensuring an Appropriate Conflict of Interest Management System |
| Clarification of fees, etc. | Principle 4 | 4. Providing Appropriate Information to Customers |
| Provide important information in an easy-to-understand manner | Principle 5 | |
| Providing the right kind of service to customers | Principle 6 | 5. Practicing Customer-Oriented Consulting |
| Appropriate incentive framework for employees, etc. | Principle 7 | 6. Establishment of a Customer-Oriented Sales System |
[2023 Action Plan]
1. Action to pursue the best interests of customers
- Through day-to-day operations and training, we will endeavor to ensure that employees make decisions and take actions based on customer-oriented business conduct. In addition, we will strive to improve customer satisfaction by receiving feedback from customers via questionnaires and reflecting their opinions in various measures and in our product and service line-up.
2. Action to ensure an appropriate conflict of interest management system
-
We will accurately identify potential conflicts of interest with customers, and manage them appropriately in accordance with our policy for the prevention of conflicts of Interest.
(Click here to view Summary of Policy on Managing Conflicts of Interest)
3. Action to provide appropriate information to customers
- We will consider the fees and commissions to be borne by customers as a factor when making transaction decisions, and will ensure transparency and provide easy-to-understand explanations, including comparisons with similar or alternative products.
- Regarding information on products we propose, we will confirm customers’ levels of understanding by providing them with appropriate explanatory materials, and our explanations will be detailed yet conducted in straightforward language.
- As part of our efforts to provide important information in an easy-to-understand manner, we will prepare an Important Information Sheet for each product, and use these sheets when giving explanations to customers.
4. Action to offer tailored advice to customers
- We will endeavor to provide customers with a full range of products and services to match their life plans and needs.
- In the event of significant changes in market trends, we will provide timely and attentive follow-up to customers to give them the information they need to make investment decisions, such as the market outlook and the current status of their assets.
- To facilitate the proposal and provision of products and services, we will periodically conduct training programs for employees to equip them with knowledge of products and other matters so that they are able to give explanations that can be fully understood by customers.
- And as a familiar and dependable advisor for corporate customers, we will acquire extensive knowledge of their businesses, and encourage them to rely on us for all their transactional needs. We will focus in particular on extending loans and providing management advice in a way that reflects the nature of and prospects for their businesses.
5. Action to establish a customer-oriented sales system
- To pursue the best interests of customers, act fairly toward them, and manage conflicts of interest appropriately, we will not only provide training to employees, but also reflect their efforts to fulfill their fiduciary duty in their evaluations, thereby establishing and instilling customer-oriented business conduct.
- We will reinforce their knowledge and skills related to products and the investment environment, and enhance their expertise as professionals by providing them with training and encouraging them to acquire external professional certifications.
- We will create an open work environment to ensure the psychological safety of employees, enhance our organizational strength by improving human resource development, and have all officers and employees work together to solve customers' problems.
[Steps Taken under 2022 Action Plan]
1. Action to pursue the best interests of customers
- Members of our executive team continued to visit branches to provide information to and engage in discussions with employees concerning customer-oriented business conduct.
- We held 77 training sessions for employees involved in recommending asset management products to improve skills, service, and quality when they make comprehensive proposals in areas such as inheritance and business succession. We strived to enhance the quality of their recommendations by helping them to leverage their high levels of expertise and financial knowledge to offer proposals that meet the diverse needs of customers.
- We sent out customer questionnaires by mail, and approximately 90% of respondents indicated that they were satisfied with the proposals and the service they had received.
2. Action to ensure an appropriate conflict of interest management system
- We determined basic matters and conducted appropriate management concerning transactions that may cause conflicts of interest so that our customers’ interests are not unduly harmed as a result of transactions by us, bank agents affiliated with us, or our group companies.
3. Action to provide appropriate information to customers
- With the aim of providing, in an easy-to-understand manner, important information for medium- to long-term asset accumulation by customers, we have introduced Important Information Sheets (Financial Instruments Business Operator Version and Individual Product Version). We are now using the Important Information Sheets as part of our efforts to provide uniform, easy-to-understand explanations of the asset management products we offer.
4. Action to offer tailored advice to customers
- To meet the needs of customers during the COVID-19 pandemic, we encouraged customers visiting our branches to take advantage of our non-face-to-face services (online consultation services, telephone banking, and internet banking).
- For customers who had applied for mutual funds, life insurance products, etc., we provided meticulous follow-up services to alleviate their concerns about fluctuating market trends.
5. Action to establish a customer-oriented sales system
- In addition to articulating our basic approach of customer orientation, we formulated a basic management policy for customer protection and a basic policy on customer-oriented business conduct (fiduciary duty) in order to put this approach into practice. And with the goal of establishing trust with customers, we formulated a basic policy on customer-oriented business conduct, and are acting to pursue the best interests of customers in all our business operations.
Common KPIs comparable across mutual fund distributors
1. Proportions of customers by investment performance of mutual funds and fund wraps
Mutual funds
The proportion of customers with positive investment performance is 64.9%.
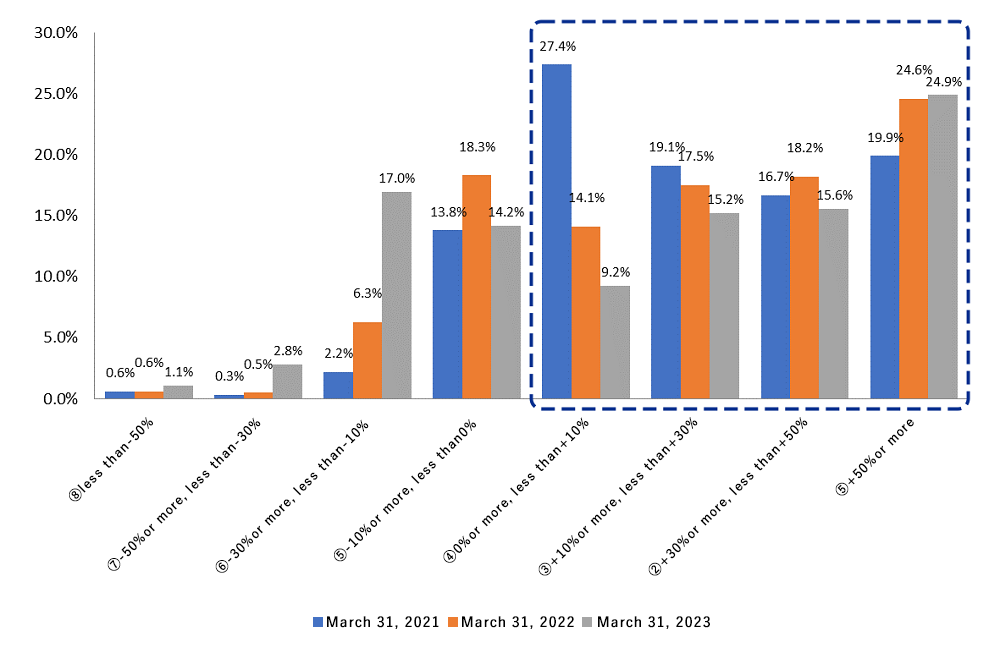
- March 31, 2021: 83.1%
- March 31, 2022: 74.3%
- March 31, 2023: 64.9%
- Note 1: Reference date is March 31 each year
- Note 2: Covers transactions by individual customers using mutual fund accounts with us
- Note 3: Investment performance is calculated as the total return on the mutual fund balance as of March 31 each year
- Note 4: Funds sold/redeemed in their entirety by the reference date are not covered
- Note 5: Investment performance is retroactive from the initial purchase of the funds
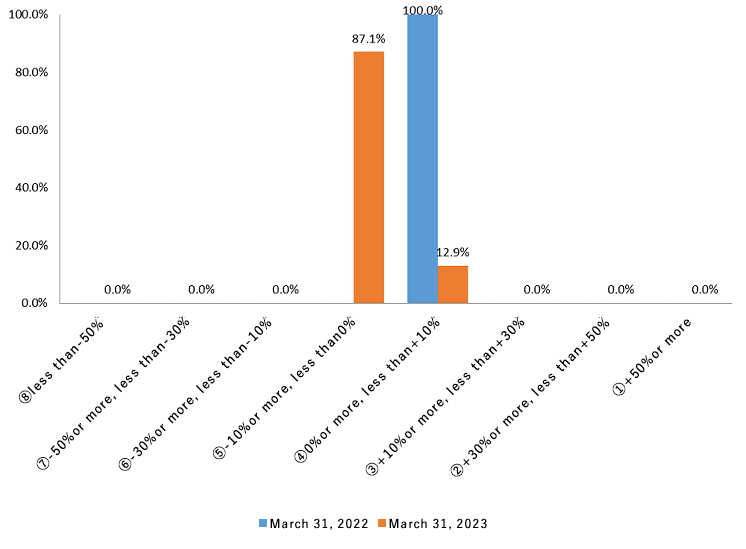
Fund wraps
The proportion of customers with positive investment performance is 12.9%.
- 1.Note 1: Reference date is March 31 each year
- 2.Note 2: Investment performance is calculated as the total return on the fund wrap balance as of March 31 each year
- 3.Note 3: Amounts are less intra-period deductions of discretionary investment management fees and other expenses
- 4.Note 4: Investment performance is retroactive from the initial transaction date
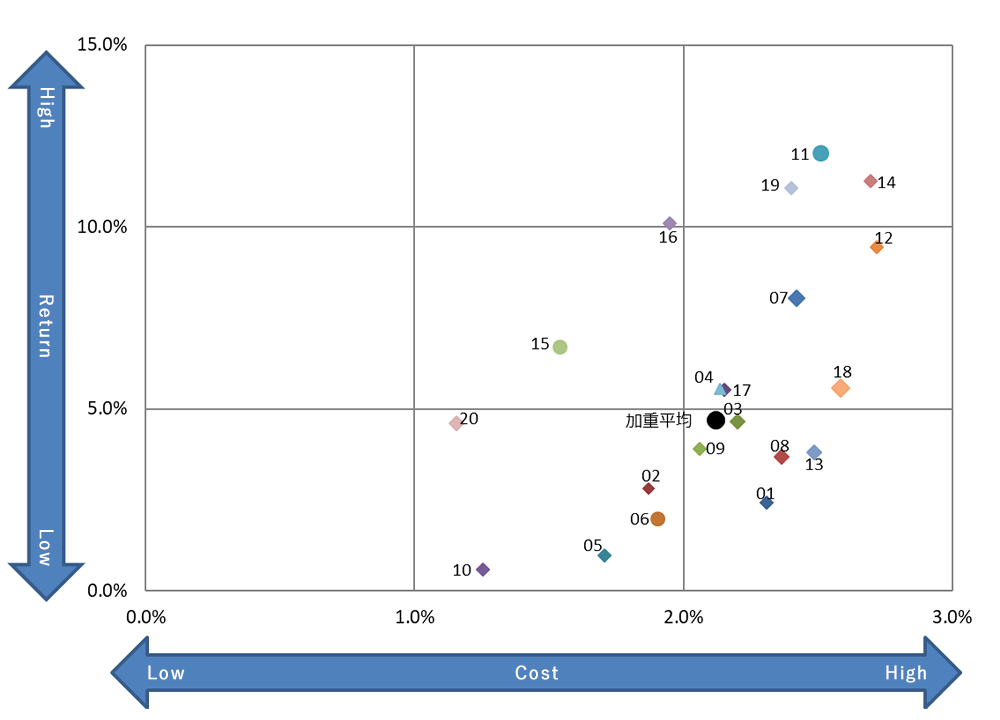
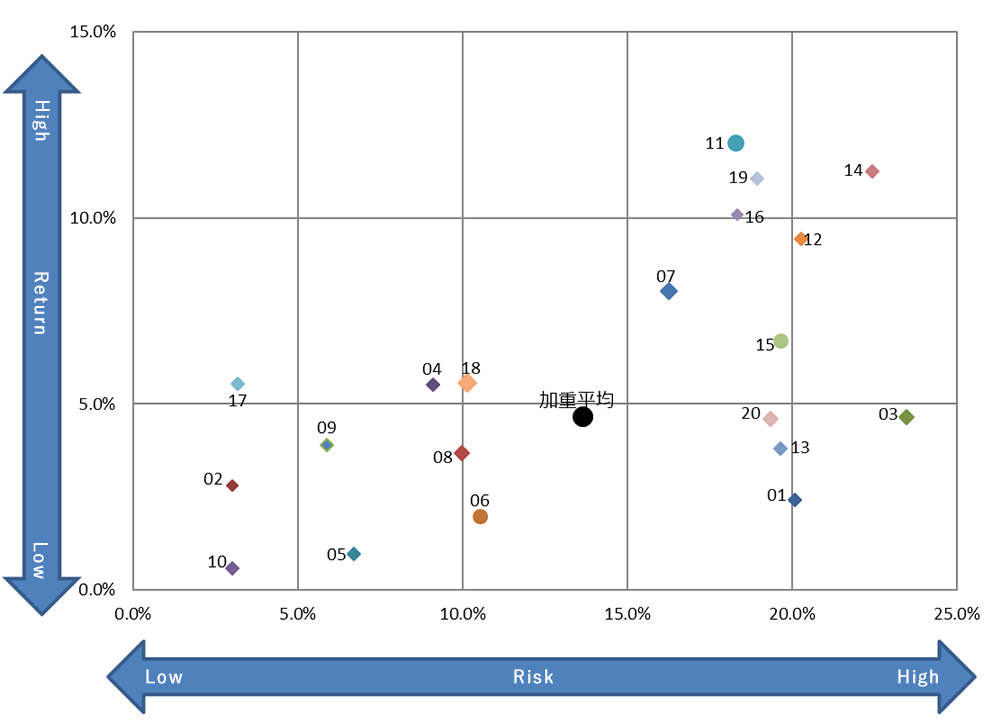
2. Cost vs. return and risk vs. return for top 20 mutual funds by balance under management
March 31, 2021
| Cost | Return | |
|---|---|---|
| Weighted average balance | 2.12% | 4.68% |
| Risk | Return | |
|---|---|---|
| Weighted average balance | 13.64% | 4.68% |
| Fund name (top 20 mutual funds by balance under management) | Cost | Risk | Return | |
|---|---|---|---|---|
| 1 | LaSalle Global REIT Fund (monthly distribution type) | 2.31% | 20.06% | 2.43% |
| 2 | Investment Sommelier | 1.87% | 3.00% | 2.82% |
| 3 | Fidelity US REIT Fund B (no currency hedge) | 2.20% | 23.47% | 4.65% |
| 4 | Fidelity Global High Yield Fund (monthly settlement type) | 2.15% | 9.10% | 5.52% |
| 5 | Global Sovereign Open (monthly settlement type) | 1.71% | 6.69% | 0.97% |
| 6 | Sumitomo Mitsui Australian Dollar Bond Fund | 1.90% | 10.53% | 1.98% |
| 7 | Asia Oceania High Dividend Growth Equity Open (monthly distribution type) | 2.42% | 16.25% | 8.03% |
| 8 | JPM Emerging Markets Sovereign Open | 2.37% | 9.96% | 3.68% |
| 9 | JPM Best Income (annual settlement type) | 2.06% | 5.89% | 3.90% |
| 10 | Tokio Marine JPY Asset Balance Fund (monthly settlement type) Nickname:YENSOKAI | 1.25% | 3.01% | 0.58% |
| 11 | SBI Mid and Small Undervalued Growth Equity Fund Jrevive (biannual settlement type) Nickname: jrevive II | 2.51% | 18.27% | 12.03% |
| 12 | Eastspring India Equity Open | 2.72% | 20.27% | 9.45% |
| 13 | LM Australia High Dividend Equity Fund (monthly distribution type) | 2.49% | 19.63% | 3.80% |
| 14 | Harris Global Equity Fund (monthly settlement type) | 2.70% | 22.43% | 11.25% |
| 15 | J-REIT Research Open (monthly settlement type) | 1.54% | 19.64% | 6.71% |
| 16 | Global Equity Income (monthly settlement type) | 1.95% | 18.32% | 10.10% |
| 17 | Nordic Corporate Bond Fund (with currency hedge) | 2.14% | 3.18% | 5.53% |
| 18 | Eastspring US High Yield Bond Open | 2.59% | 10.13% | 5.57% |
| 19 | JPM Global Medical Related Equity Fund | 2.40% | 18.93% | 11.07% |
| 20 | MHAM J-REIT Index Fund (monthly settlement type) Nickname: Building Owner | 1.16% | 19.34% | 4.60% |
- Note 1: Reference date is March 31, 2021
- Note 2: Funds covered: Top 20 funds by balance under management (established for five years or longer) (excluding privately-placed mutual funds)
- Note 3: Cost: Sales commission as of reference date (sales commission rate ÷ 5) + trust fee rate (annual rate)
- Note 4: Risk: Standard deviation of monthly return during past five years (annualized)
- Note 5: Return: Total return during past five years (annualized) The NAV used in calculating the percentage change in NAV is the NAV after re-investment of dividends (before tax)
March 31, 2022
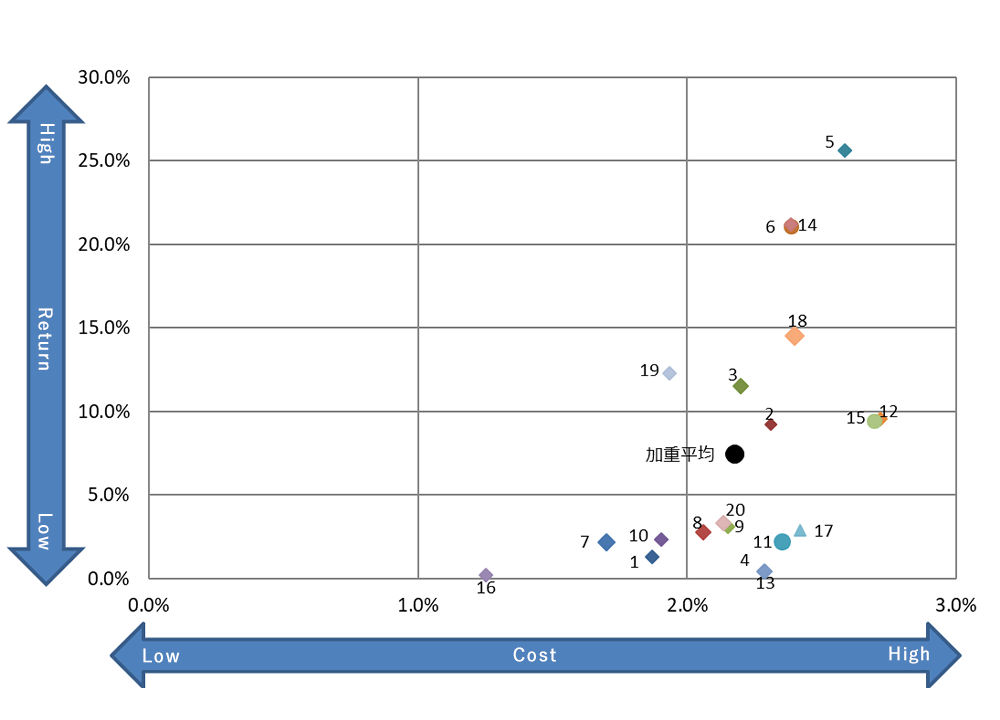
| Cost | Return | |
|---|---|---|
| Weighted average balance | 2.18% | 7.43% |
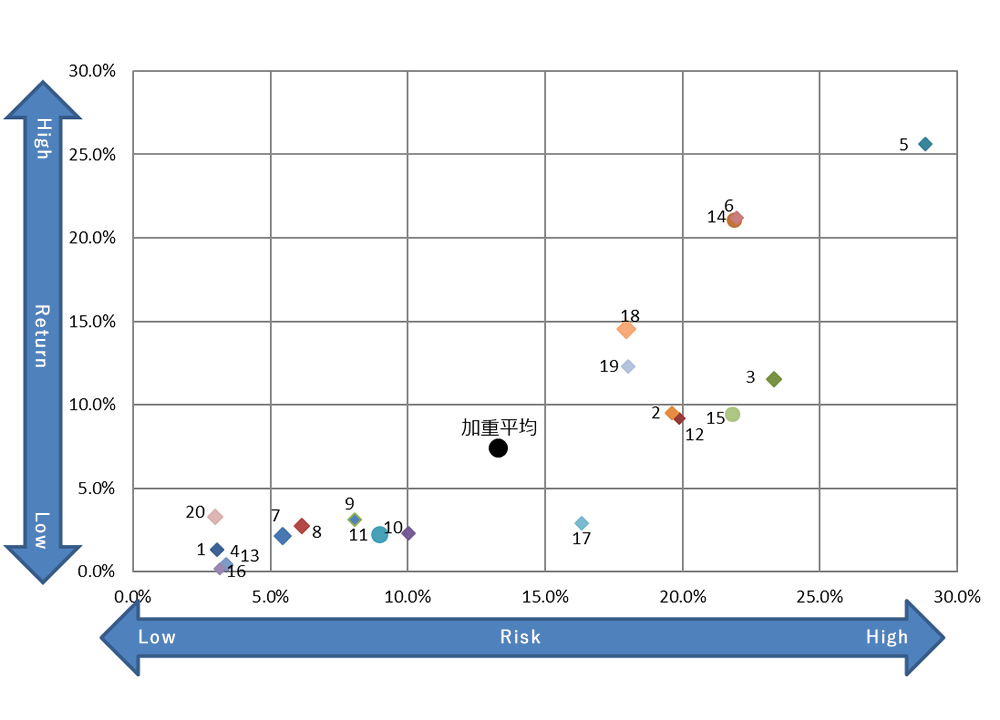
| Risk | Return | |
|---|---|---|
| Weighted average balance | 13.28% | 7.43% |
| Fund name (top 20 mutual funds by balance under management) | Cost | Risk | Return | |
|---|---|---|---|---|
| 1 | Investment Sommelier | 1.87% | 3.07% | 1.32% |
| 2 | LaSalle Global REIT Fund (monthly distribution type) | 2.31% | 19.87% | 9.21% |
| 3 | Fidelity US REIT Fund B (no currency hedge) | 2.20% | 23.34% | 11.53% |
| 4 | Nomura PIMCO World Income Strategy Fund A Course (with currency hedge, biannual settlement type) | 2.29% | 3.39% | 0.41% |
| 5 | Global AI Fund | 2.59% | 28.85% | 25.61% |
| 6 | AllianceBernstein US Growth Equity Fund D Course monthly settlement type (no currency hedge) forecast distribution type | 2.39% | 21.86% | 21.09% |
| 7 | Global Sovereign Open (monthly settlement type) | 1.70% | 5.45% | 2.16% |
| 8 | JPM Best Income (monthly settlement type) | 2.06% | 6.14% | 2.75% |
| 9 | Fidelity Global High Yield Fund (monthly settlement type) | 2.15% | 8.06% | 3.10% |
| 10 | Sumitomo Mitsui Australian Dollar Bond Fund | 1.90% | 10.03% | 2.31% |
| 11 | JPM Emerging Markets Sovereign Open | 2.35% | 8.95% | 2.25% |
| 12 | Eastspring India Equity Open | 2.72% | 19.60% | 9.35% |
| 13 | Nomura PIMCO World Income Strategy Fund C Course (with currency hedge, monthly settlement type) | 2.29% | 3.38% | 0.43% |
| 14 | AllianceBernstein US Growth Equity Fund B Course (no currency hedge) | 2.39% | 21.97% | 21.21% |
| 15 | Harris Global Equity Fund (monthly settlement type) | 2.70% | 21.79% | 9.46% |
| 16 | Tokio Marine JPY Asset Balance Fund (monthly settlement type) Nickname: YENSOKAI | 1.25% | 3.14% | 0.21% |
| 17 | Asia Oceania High Dividend Growth Equity Open (monthly distribution type) | 2.42% | 16.32% | 2.89% |
| 18 | JPM Global Medical Related Equity Fund | 2.40% | 17.94% | 14.55% |
| 19 | Global Equity Income (monthly settlement type) | 1.94% | 18.02% | 12.29% |
| 20 | Nordic Corporate Bond Fund (with currency hedge) | 2.14% | 3.00% | 3.29% |
- Note 1: Reference date is March 31, 2022
- Note 2: Funds covered: Top 20 funds by balance under management (established for five years or longer) (excluding privately-placed mutual funds)
- Note 3: Cost: Sales commission as of reference date (sales commission rate ÷ 5) + trust fee rate (annual rate)
- Note 4: Risk: Standard deviation of monthly return during past five years (annualized)
- Note 5: Return: Total return during past five years (annualized) The NAV used in calculating the percentage change in NAV is the NAV after re-investment of dividends (before tax)
March 31, 2023
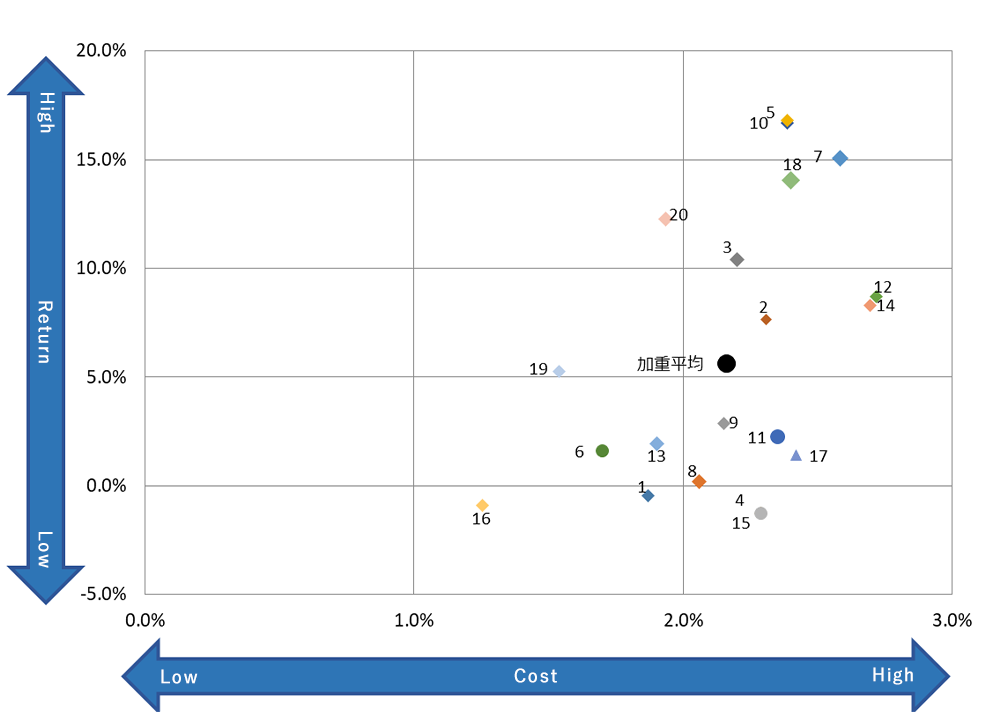
| Cost | Return | |
|---|---|---|
| Weighted average balance | 2.16% | 5.61% |
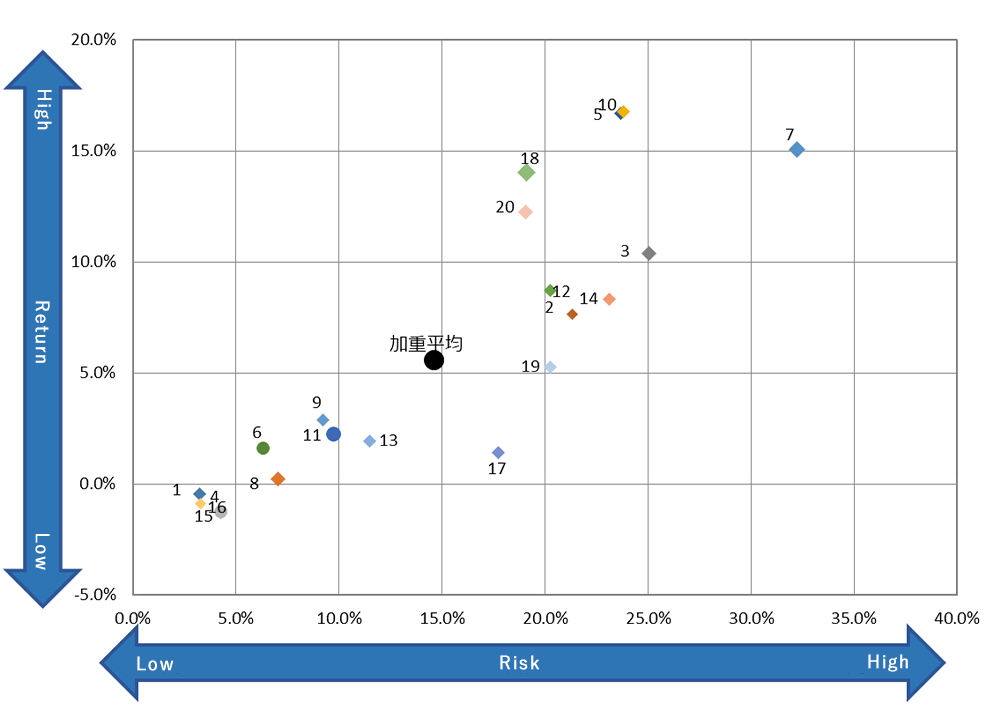
| Risk | Return | |
|---|---|---|
| Weighted average balance | 14.60% | 5.61% |
| Fund name (top 20 mutual funds by balance under management) | Cost | Risk | Return | |
|---|---|---|---|---|
| 1 | Investment Sommelier | 1.87% | 3.2% | -0.4% |
| 2 | LaSalle Global REIT Fund (monthly distribution type) | 2.31% | 21.3% | 7.7% |
| 3 | Fidelity US REIT Fund B (no currency hedge) | 2.20% | 25.0% | 10.4% |
| 4 | Nomura PIMCO World Income Strategy Fund A Course (with currency hedge, biannual settlement type) | 2.29% | 4.3% | -1.3% |
| 5 | AllianceBernstein US Growth Equity Fund D Course monthly settlement type (no currency hedge) forecast distribution type | 2.39% | 23.7% | 16.7% |
| 6 | Global Sovereign Open (monthly settlement type) | 1.70% | 6.3% | 1.6% |
| 7 | Global AI Fund | 2.59% | 32.2% | 15.1% |
| 8 | JPM Best Income (monthly settlement type) | 2.06% | 7.0% | 0.2% |
| 9 | Fidelity Global High Yield Fund (monthly settlement type) | 2.15% | 9.2% | 2.9% |
| 10 | AllianceBernstein US Growth Equity Fund B Course (no currency hedge) | 2.39% | 23.8% | 16.8% |
| 11 | JPM Emerging Markets Sovereign Open | 2.35% | 9.7% | 2.2% |
| 12 | Eastspring India Equity Open | 2.72% | 20.3% | 8.7% |
| 13 | Sumitomo Mitsui Australian Dollar Bond Fund | 1.90% | 11.5% | 1.9% |
| 14 | Harris Global Equity Fund (monthly settlement type) | 2.70% | 23.1% | 8.3% |
| 15 | Nomura PIMCO World Income Strategy Fund C Course (with currency hedge, monthly settlement type) | 2.29% | 4.2% | -1.3% |
| 16 | Tokio Marine JPY Asset Balance Fund (monthly settlement type) Nickname: YENSOKAI | 1.25% | 3.3% | -0.9% |
| 17 | Asia Oceania High Dividend Growth Equity Open (monthly distribution type) | 2.42% | 17.7% | 1.4% |
| 18 | JPM Global Medical Related Equity Fund | 2.40% | 19.1% | 14.0% |
| 19 | J-REIT Research Open (monthly settlement type) | 1.54% | 20.3% | 5.2% |
| 20 | Global Equity Income (monthly settlement type) | 1.94% | 19.1% | 12.3% |
- Note 1: Reference date is March 31, 2023
- Note 2: Funds covered: Top 20 funds by balance under management (established for five years or longer) (excluding privately-placed mutual funds)
- Note 3: Cost: Sales commission as of reference date (sales commission rate ÷ 5) + trust fee rate (annual rate)
- Note 4: Risk: Standard deviation of monthly return during past five years (annualized)
- Note 5: Return: Total return during past five years (annualized) The NAV used in calculating the percentage change in NAV is the NAV after re-investment of dividends (before tax)
Common KPIs comparable across foreign-currency-denominated insurance distributors
3. Proportions of customers by investment performance of foreign-currency-denominated insurance
The proportion of customers with positive investment performance for foreign-currency-denominated insurance is 57.7%.
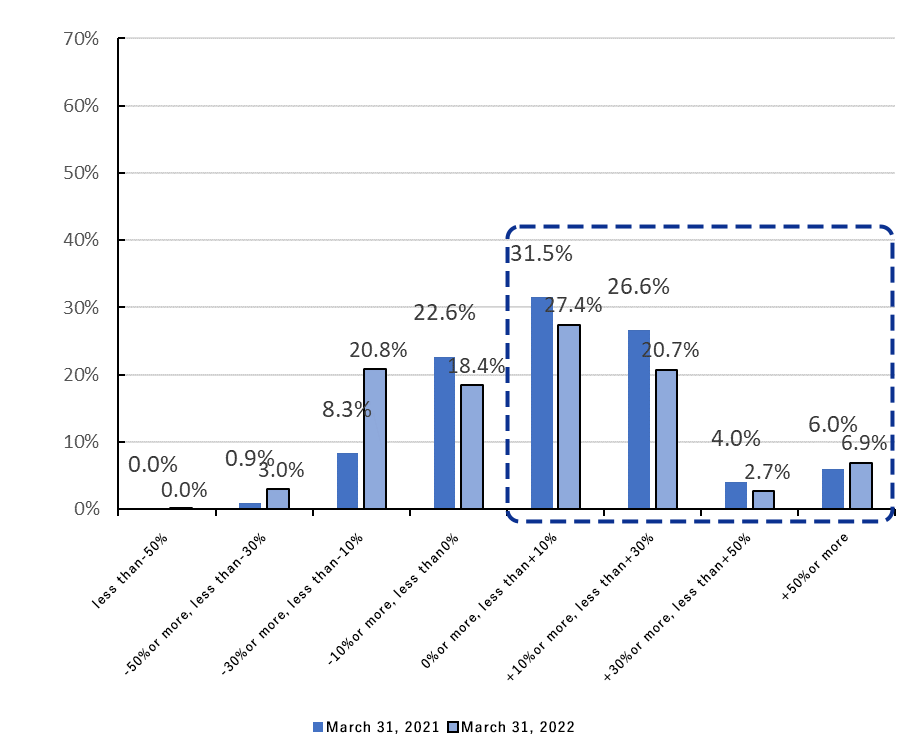
- 1.Note 1: Reference date is March 31 each year
- 2.Note 2: Covers transactions by individual customers using our foreign-currency-denominated insurance
- 3.Note 3: Contracts that had already been canceled and annuity insurance contracts for which annuity payments had already begun as of the reference date are excluded
- 4.Note 4: Investment performance is calculated using the foreign-currency-denominated insurance balance as of March 31 each year
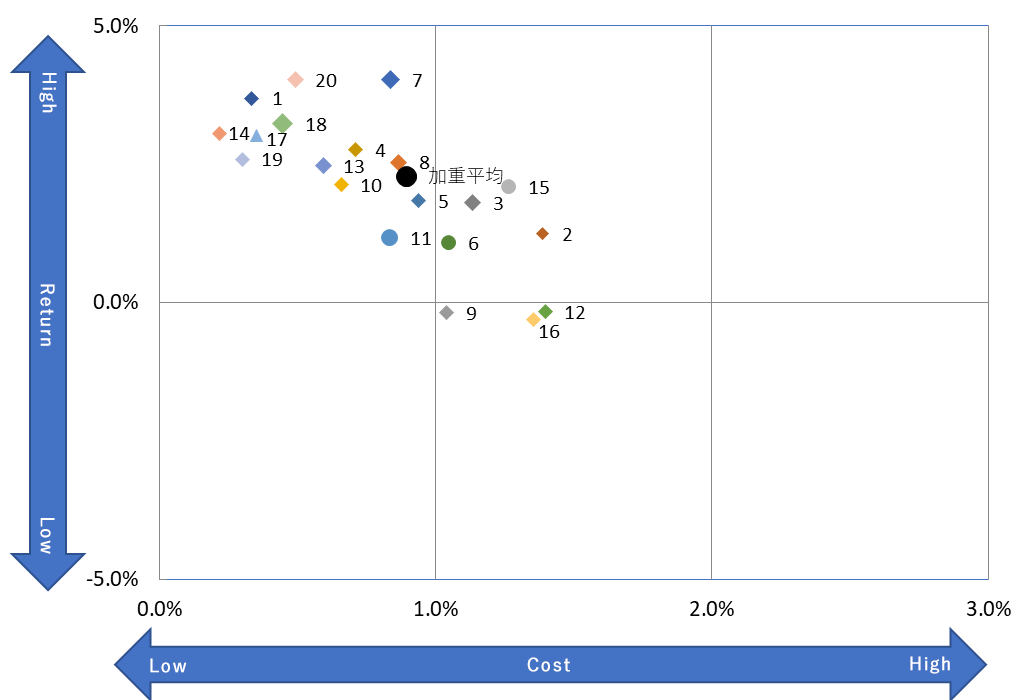
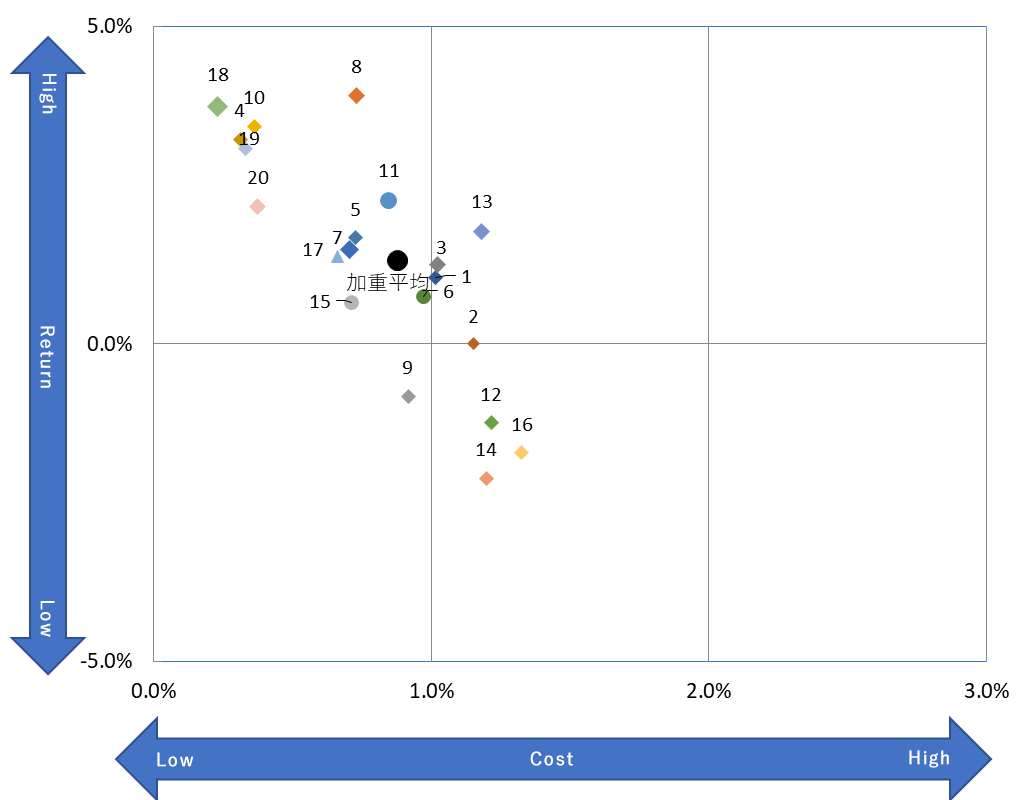
4. Cost vs. return for each foreign-currency-denominated insurance product
March 31, 2022
| Cost | Return | |
|---|---|---|
| Weighted average | 0.89% | 2.27% |
| Product name | Cost | Return | |
|---|---|---|---|
| 1 | Montagne | 0.33% | 3.70% |
| 2 | Whole Life Insurance for Enjoying the Future | 1.39% | 1.24% |
| 3 | Premier Receive (foreign-currency-denominated) | 1.13% | 1.81% |
| 4 | Life Long Select PG | 0.71% | 2.76% |
| 5 | Happiness, Ever | 0.94% | 1.84% |
| 6 | Life Long Select PG3 | 1.05% | 1.08% |
| 7 | Be With You (US-dollar-denominated) | 0.84% | 4.04% |
| 8 | Life Long Select PG2 | 0.87% | 2.54% |
| 9 | Kindness Connected | 1.04% | -0.19% |
| 10 | Three Continents | 0.66% | 2.13% |
| 11 | Be With You (Australian-dollar-denominated) | 0.83% | 1.18% |
| 12 | Double Account Global Australian | 1.40% | -0.17% |
| 13 | Advantage Select PG | 0.59% | 2.47% |
| 14 | Sirius Plus | 0.22% | 3.06% |
| 15 | Be With You Plus | 1.27% | 2.09% |
| 16 | Double Account Global US | 1.35% | -0.31% |
| 17 | Long Dream | 0.35% | 3.02% |
| 18 | Montagne 2 | 0.45% | 3.23% |
| 19 | Upside | 0.30% | 2.29% |
| 20 | Long Dream Plus | 0.49% | 4.02% |
- Note 1: Reference date is March 31, 2022
- Note 2: Products covered: Products among foreign-currency-denominated lump-sum payment insurance products where contracts exist for which 60 months or more has passed since the inception of the insurance contract (top 20 products)
March 31, 2023
| Cost | Return | |
|---|---|---|
| Weighted average | 0.88% | 1.32% |
| Product name | Cost | Return | |
|---|---|---|---|
| 1 | Premier Receive (foreign-currency-denominated) | 1.01% | 1.04% |
| 2 | Whole Life Insurance for Enjoying the Future | 1.15% | 0.00% |
| 3 | Happiness, Ever | 1.02% | 1.25% |
| 4 | Montagne | 0.31% | 3.22% |
| 5 | Life Long Select PG | 0.73% | 1.67% |
| 6 | Life Long Select PG3 | 0.97% | 0.74% |
| 7 | Three Continents | 0.71% | 1.48% |
| 8 | Be With You (US-dollar-denominated) | 0.73% | 3.90% |
| 9 | Kindness Connected | 0.92% | -0.83% |
| 10 | Sirius Dual | 0.36% | 3.42% |
| 11 | Life Long Select PG2 | 0.85% | 2.26% |
| 12 | Be With You Plus | 1.22% | -1.25% |
| 13 | Life Premium World 4 | 1.18% | 1.77% |
| 14 | Double Account Global Australian | 1.20% | -2.12% |
| 15 | Be With You (Australian-dollar-denominated) | 0.71% | 0.65% |
| 16 | Double Account Global US | 1.33% | -1.72% |
| 17 | Advantage Select PG | 0.66% | 1.38% |
| 18 | Sirius Plus | 0.23% | 3.74% |
| 19 | Long Dream | 0.33% | 3.08% |
| 20 | Montagne 2 | 0.37% | 2.16% |
- Note 1: Reference date is March 31, 2023
- Note 2: Products covered: Products among foreign-currency-denominated lump-sum payment insurance products where contracts exist for which 60 months or more has passed since the inception of the insurance contract (top 20 products)